Introduction to Vectors
A study of motion will involve the introduction of a variety of quantities that are used to describe the physical world. Examples of such quantities include distance, displacement, speed, velocity, acceleration, force, mass, momentum, energy, work, power, etc. All these quantities can by divided into two categories - vectors and scalars. A vector quantity is a quantity that is fully described by both magnitude and direction. On the other hand, a scalar quantity is a quantity that is fully described by its magnitude. The emphasis of this unit is to understand some fundamentals about vectors and to apply the fundamentals in order to understand motion and forces that occur in two dimensions.
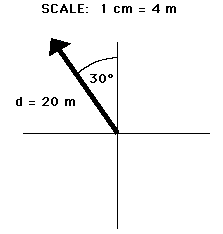 Vector quantities are often represented by scaled vector diagrams. Vector diagrams depict a vector by use of an arrow drawn to scale in a specific direction. Vector diagrams were introduced and used in earlier units to depict the forces acting upon an object. Such diagrams are commonly called as free-body diagrams. An example of a scaled vector diagram is shown in the diagram in the right. The vector diagram depicts a displacement vector. Observe that there are several characteristics of this diagram that make it an appropriately drawn vector diagram.
- a scale is clearly listed
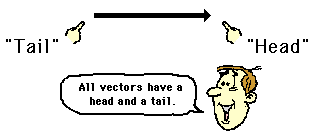
- a vector arrow (with arrowhead) is drawn in a specified direction. The vector arrow has a head and a tail.
- the magnitude and direction of the vector is clearly labeled. In this case, the diagram shows the magnitude is 20 m and the direction is (30 degrees West of North).
Vector Direction
To fully describe a vector quantity, it is necessary to tell both the magnitude and the direction. For instance, if the velocity of an object were said to be 25 m/s, then the description of the object's velocity is incomplete; the object could be moving 25 m/s south, or 25 m/s north or 25 m/s southeast. To fully describe the object's velocity, both magnitude (25 m/s) and direction (e.g., south) must be stated.
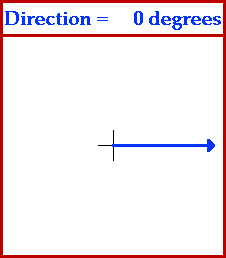
In order for such descriptions of vector quantities to be useful, it is important that everyone agree upon how the direction of an object is described. The convention upon which we can all agree is sometimes referred to as the CCW convention - counterclockwise convention. Using this convention, we can describe the direction of any vector in terms of its counterclockwise angle of rotation from due east. The direction north would be at 90 degrees since a vector pointing east would have to be rotated 90 degrees in the counterclockwise direction in order to point north. The direction of west would be at 180 degrees since a vector pointing west would have to be rotated 180 degrees in the counterclockwise direction in order to point west. Further illustrations of the use of this convention are depicted by the animation below.
Vector Addition: The Order Doesn't Matter
The summative result of two or more vectors can be determined by a process of vector addition. The most common method of adding vectors is the graphical method of head-to-tail addition. This method involves the selection of a scale (e.g., 1 cm = 5 km), and the subsequent drawing of each vector to scale in the specific direction. The tail of each consecutive vector begins at the head of the most recent vector. The resultant vector (the summative result of the addition of the given vectors) is then drawn from the tail of the first vector to the head of the last vector. The magnitude and direction of the resultant is then determined using a protractor, ruler, and the indicated scale.
The question often arises as to the importance of the order in which the vectors are added. For instance, if five vectors are added - let's call them vectors A, B, C, D and E - then will a different resultant be obtained if a different order of addition is used. Will A + B + C + D + E yield the same result as C + B + A + D + E or D + E + A + B + C? The animation below provides the answer. Observe the animation a couple of times and see what the answer is.
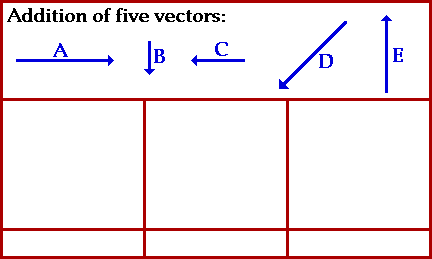
As you can see, adding vectors, like in mathematical addition, the order of the vector doesn't matter.
Sample Problems on Vectors
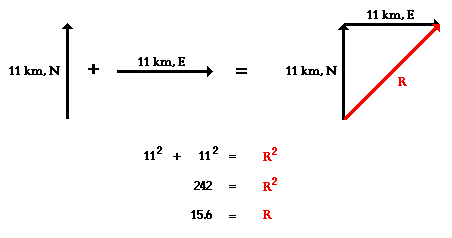
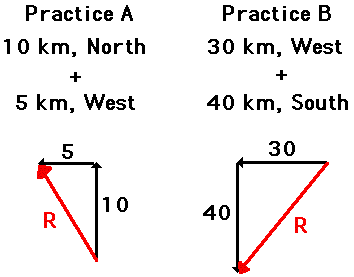
R2 = (5)2 + (10)2 R2 = (30)2 + (40)2
R2 = 125 R2 = 2500
R = SQRT (125) R = SQRT (2500)
R = 11.2 km R = 50 km
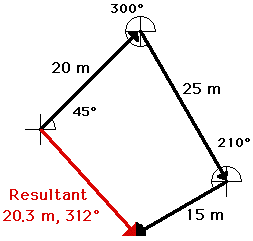
20 m, 45 deg. + 25 m, 300 deg. + 15 m, 210 deg.
SCALE: 1 cm = 5 m
Relating vectors to life: It is really of use in traveling-purposes especially when one is lost in the forest or dessert (I think) and you have no choice but to use your brain and find a compass. Well, reading a compass is somewhat related to analyzing 'counterclockwise convention' and eventually to vectors. Bow.